Bugs and errors are a software developer's nightmare. Unfortunately, finding and fixing them can cost you more time and money than the actual development. In fact, one study shows that over 50-75% of the total budget of software development projects is spent on debugging.
Technical discovery involves researching, documenting, and analyzing your code, including making intelligent assumptions that could help determine the root cause of incorrectness — a bug, an error, or a need for a performance upgrade.
In some organizations, the QA team handles technical discoveries, while some teams do not add technical discovery at all in their workflow. The truth is that if you want to be effective and fast at the same time in your problem-solving effort, your team must find a way to narrow down your error or bug-hunting effort with technical discoveries.
That way, you'll spend less time debugging and fixing issues and spend more time building more product features or improving your application's performance and reliability.
In this article, we'll learn how to properly create a technical discovery that makes your team more productive.
Tools to make Technical Discovery easy
Logging and monitoring
Logging is integral to every software as it details important events in your application during execution time. In addition, it's important for technical discovery as it will allow you to learn the history of your software's incorrectness.
Depending on the programming language your product is built with, there is always a library that helps with logging errors or warnings — there are also cloud services that help with that as well, like LogRocket and FullStory. Some examples of open source logging libraries for Node.js includes Pino, Winston, Bunyan, etc.
Instrumentation
Code instrumentation is a technique that is used to understand a system's behavior, locate the root cause of bugs, and improve software quality and performance.
By instrumenting your code, you'll add additional code to your codebase that is meant to monitor the end-to-end flow of your logic. That way, you'll have a general overview of what is going on in your codebase — You can use tools like Grafana and Open Telemetry to orchestrate instrumentation. This can be helpful during technical discovery as it can serve as a point of reference when documenting the causes of your code problems.
If you haven't integrated an instrumentation tool yet, you should consider doing it because it can be instrumental in making your technical discovery much easier.
Debuggers
A debugger is a development tool that allows you to step through another program one line at a time, taking notes of breakpoints and viewing data during execution which allows you to identify code incorrectness and the flow of the program.
Debuggers are everywhere — you can find them in your code editor, your browser, or stand-alone software. So, whatever environment and language your project is built on, there is always a debugger for you.
Steps to document your discovery
This is the part where you create the actual technical discovery documentation, which will be based on the data you gathered from your logging, instrumentation, and further investigations.
1. Log file and instrumentation data analysis
Analyze the log files generated by your logging library using open source tools like Log Analyzer, LogHell, etc.
Take note of the date and time of events.
Look for issues that could have direct co-relation with the problem you are trying to solve and the ones that could be an accidental consequence of the root cause. Take note of everything related to the files and the problem you are trying to solve.
Do the same for your instrumentation and tracing efforts, take screenshots where necessary, follow the code execution flow as much as possible and record them.
2. Document your analysis and research result
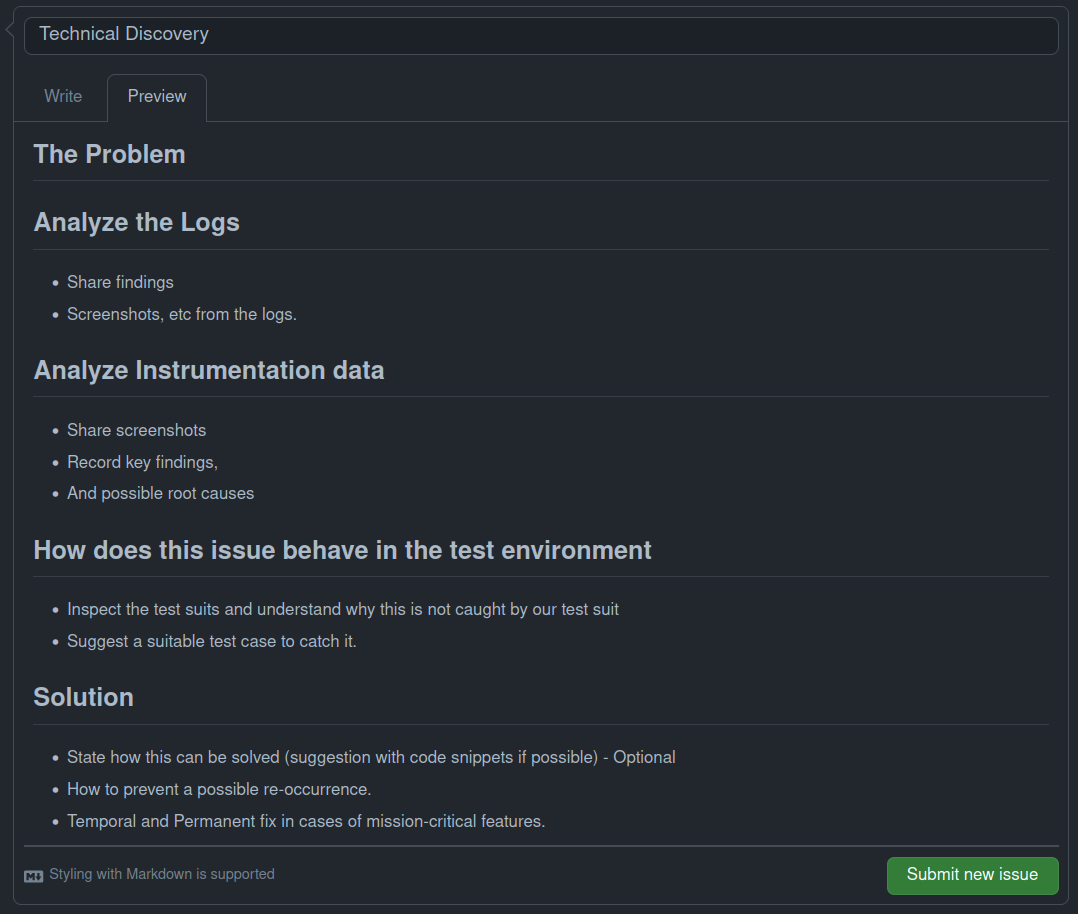
Create a document either on Google docs, on GitHub issues, or on whatever platform your team decides to use for this kind of documentation. If you are going to use GitHub issues, I'll recommend that you use the GitHub issues template to configure a template that can be re-used for every discovery documentation, like the example below:
3. Quality assurance (QA) and reproduce the issue
Obviously, your automated test didn't catch this particular issue. That's why you are trying to find the root cause. Otherwise, you'd have found it before deploying it to production. To ensure that this problem exists, you want to try to reproduce the issue with test data in the same condition or codebase. Try to perform the task the user was trying to perform using the same machine.
For example, if the issue was reported to have happened in a Mac OS environment, try to reproduce the error in a Mac OS environment, on Windows, and Linux, on a different browser, etc. as the case may be to catch edge cases and to know if it's a device compatibility problem. Record your findings.
4. Look into the Git history
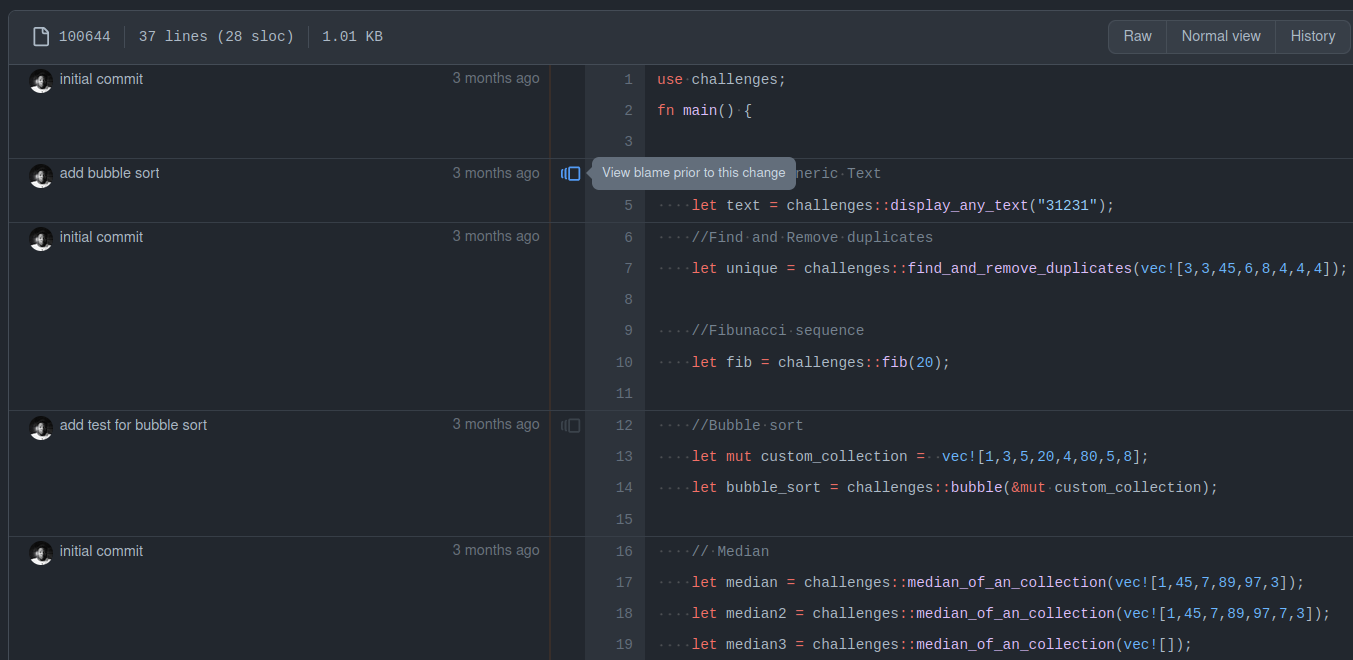
Check the Git history and see where it worked the last time and when the new code that caused the issue was introduced. You can use GitHub Desktop or Github web to examine the history, or any other Git GUI or CLI. I find using Git blame very useful, as well as it gives you information about who added the code before and after the error. That way, you could mention them to be part of the team solving the problem since they are already familiar with the code base.
Open the file which (you suspect) has the problem and click on the Blame button. Next, you'll see the current code shown on the right side and for each line/section of code the last commit which changed that code. You can click on the highlighted link in the image below to go back to the code that existed before the current code.
Make sure you come up with a hypothesis and try to prove that your hypothesis was wrong or correct by looking deeper into the code and trying to make it or break it. Document whatever observation you get from this activity.
5. Use Debuggers and record results
Debuggers can reveal a lot about how your code works, how data flows in your program, etc. You don't want to leave out this information during your technical discovery process, as it could be a fast way to get an idea of what could be wrong with your code. For a frontend application, Google has a comprehensive guide that shows how to use Google Chrome to debug your code.
Gather all the information you'll need from the debugger and document it. Finally, you can submit your discoveries to the appropriate team for triage and eventual fixing of the issue.
Conclusion
The importance of technical discovery can not be over-emphasized, as seen in this article. Depending on the size of your project, you might not need to implement all the steps in this guide, but whichever one fits into your workflow, you should add it — reduce your problem-solving time and solve problems once and for all and avoid re-occurrence.
You could even find more incorrectness in your code in the process, and if for any reason something happens that relates to that issue, this document can serve as a starting point for whoever is going to work on the issue. Document everything.
Happy discovery!
